
Phoenix Real Estate Market is Still Hot!
Once again, here is our table of Cromford® Market Index (CMI)* values for the single-family markets in the 17 largest cities
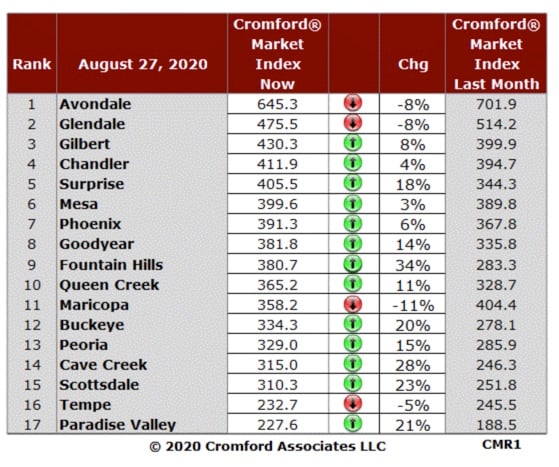
The number of red dots has doubled again since last week, with Avondale and Glendale joining Tempe and Maricopa as locations where the seller's advantage is getting slightly lower. Not that you would notice much - with every one of the 17 cities well over 200, we have one of the strongest seller's markets we have ever seen.
Meanwhile, the average increase in the CMI is still 10.2% over the last month, which would be considered remarkable if we had not just seen much higher percentages over the past 2 months.
We can see Fountain Hills, Scottsdale, Cave Creek, and Paradise Valley all moving strongly in a direction favorable to sellers. Fountain Hills and Cave Creek have unusually low numbers of active listings at the moment, which must be very frustrating for buyers who want homes in these towns.
Surprise, Buckeye, Peoria, and Goodyear are the top performers among the more affordable areas of the valley.
When comparing home prices in Arizona to other large metropolitan cities, we look at the S&P Case-Shiller Home Price Index numbers, which were published yesterday. Yesterday's published report covers home sales during the period April to June 2020.
For most of the 20 metropolitan areas, prices lost steam compared with the previous month. However, this is because the weaker months of April and May are included, but the stronger and more recent months of June and July are excluded.
Compared with the previous month's series, we see the following changes:
The national average was +0.56% so Phoenix home prices increased at a higher rate than the national average, but slipped from 2nd to 3rd place compared with last month..
The year-over-year comparisons are below:
The national average was 4.29%, down from 4.46% last month. Phoenix remained in the top spot yet again and now has opened up a bigger gap of 2.5% over the number 2 city - Seattle.
*Cromford Market Index™ is a value that provides a short-term forecast for the balance of the market. It is derived from the trends in pending, active, and sold listings compared with historical data over the previous four years. Values below 100 indicate a buyer's market, while values above 100 indicate a seller's market. A value of 100 indicates a balanced market.
Stay up to date on the latest real estate trends.

New listings remain stubbornly low, especially in the price ranges that are most popular with buyers.

Looking for things to do around the valley this month? Look no further.

Supply remains lower than last year, but the gap closed slightly.

Understand why mortgage interest rates are climbing and what it means for your home buying plans.

Explore the latest real estate trends and price per square foot growth across various Arizona cities.

This is truly the most important question to answer. Forget the finances for a minute.

Discover why professional home staging is essential for attracting buyers.

Navigate the shifting Greater Phoenix real estate market with insights on price trends.

Don't let dated fixtures scare away potential buyers. Learn how to update your home's finishes.
At The Raegen Johnson Group, real estate has always been about more than buying or selling a home. It’s about the people, the relationships we build, and the trust we’re honored to earn. Every client becomes part of our story, and every relationship is one we cherish long after closing day.

THE RAEGEN JOHNSON GROUP
REAL BROKERAGE LLC
(602) 330-5362
[email protected]
3707 E Southern Ave STE 1074 Mesa AZ, 85206