AZ Housing Market. Changing Quickly
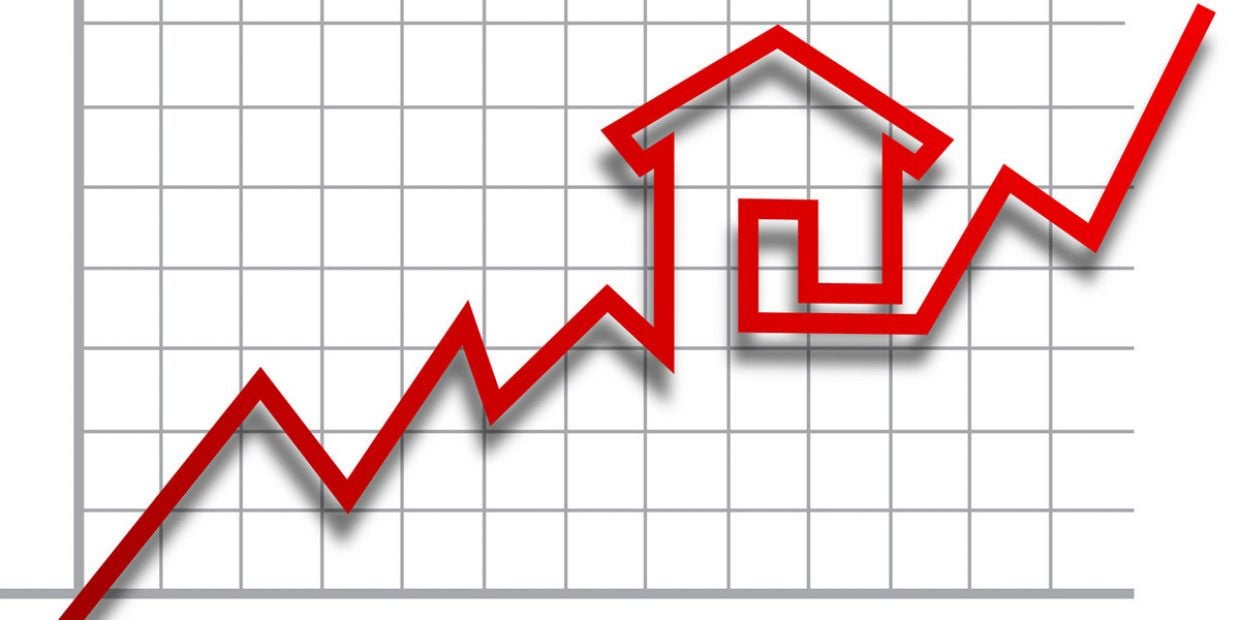
In the first few days of last week, there was little sign of the pandemic having an effect on the housing market. However, March 19, 20, & 21 (Thursday, Friday, and especially Saturday) have given us much more to chew on. There are a number of effects happening at the same time, all of which combine to create a sharp slowdown in demand and an increase in supply. The effects differ by geography and price range.
Active listings without a contract across all areas & types stood at 12,086 on Saturday - up 9% from a week earlier. This is a sudden change from the previous week when counts were close to flat week on week. This is due to a couple of large effects and one small one:
Since we are all supposed to be avoiding physical human contact, it is not surprising that showing activity has dropped dramatically. Few normal buyers are willing to make an offer without viewing a property, though some investors may be tempted. Since real estate activity has been declared a non-essential business, buying and selling, as well as construction, are likely to drop sharply, especially if a close-down is ordered by the government, as it has in several states. In fact, I am surprised that showings remain as high as they do. Some people are clearly not taking the pandemic seriously enough, which is a big mistake that will cause the virus to spread more quickly and incur a higher mortality rate.
The increase in listings is heavily skewed towards the mid-price end of the market. Between Sunday 15 and Sunday 22, we see an overall increase of 11% in active listings without a contract. However, there is NO increase in active listings over $800,000. Between $150,000 and $300,000, we have an increase of 19% in a single week.
Of course, we were starting from an excruciatingly low inventory of active listings between $150,000 and $300,000, so it is not hard to see a high percentage increase from such an abnormally low base.
Why are we seeing more active listings so quickly?
We see the following increases for single-family homes in the 17 largest cities:
The Southeast Valley is seeing the largest percentages, as well as Avondale, which had an extremely low number of listings to start.
Below is a breakdown by dwelling type; condos and townhomes are being added most quickly, consistent with the liquidation of Airbnb assets:
The speed of change is as high as we have ever seen and underscores why it is important to monitor the housing market on a daily basis, not once a month as most people do.
We will look more closely at the demand side tomorrow.
Stay up to date on the latest real estate trends.
New listings remain stubbornly low, especially in the price ranges that are most popular with buyers.

Looking for things to do around the valley this month? Look no further.

Supply remains lower than last year, but the gap closed slightly.
Understand why mortgage interest rates are climbing and what it means for your home buying plans.
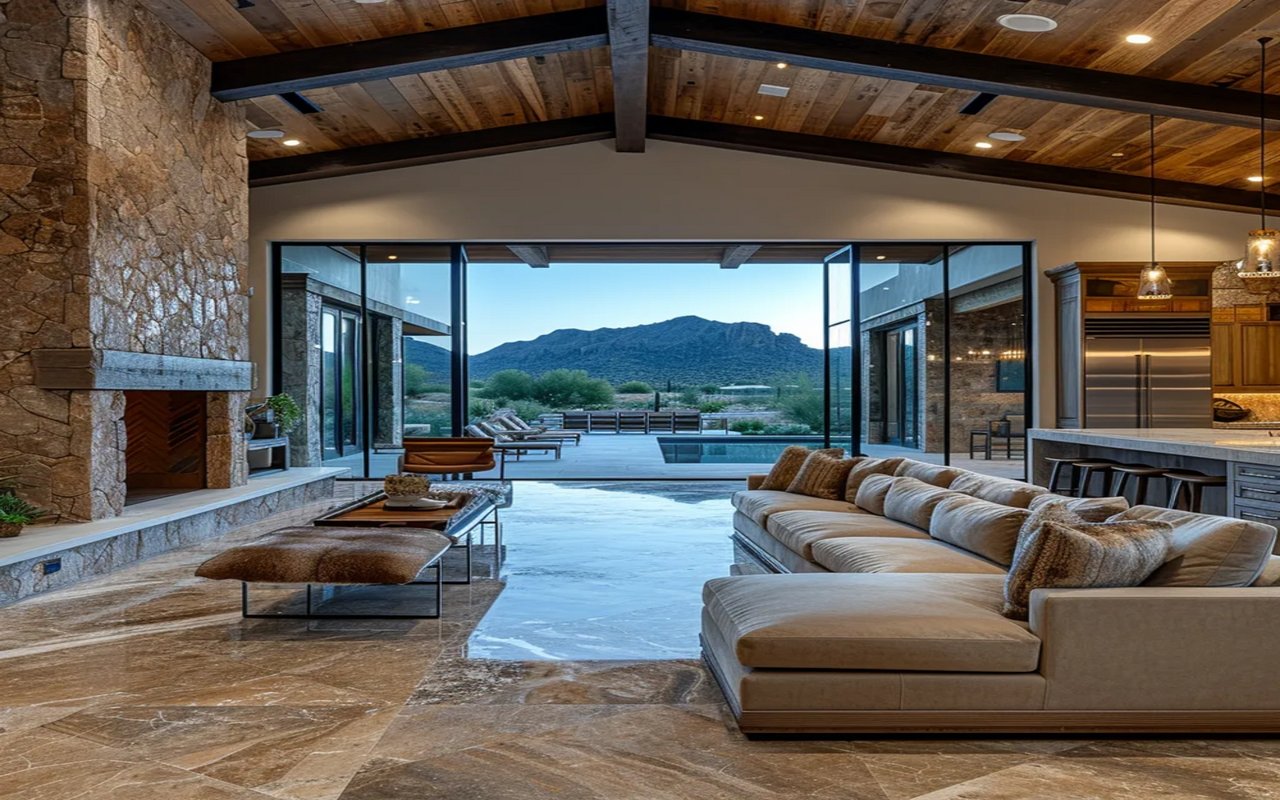
Explore the latest real estate trends and price per square foot growth across various Arizona cities.
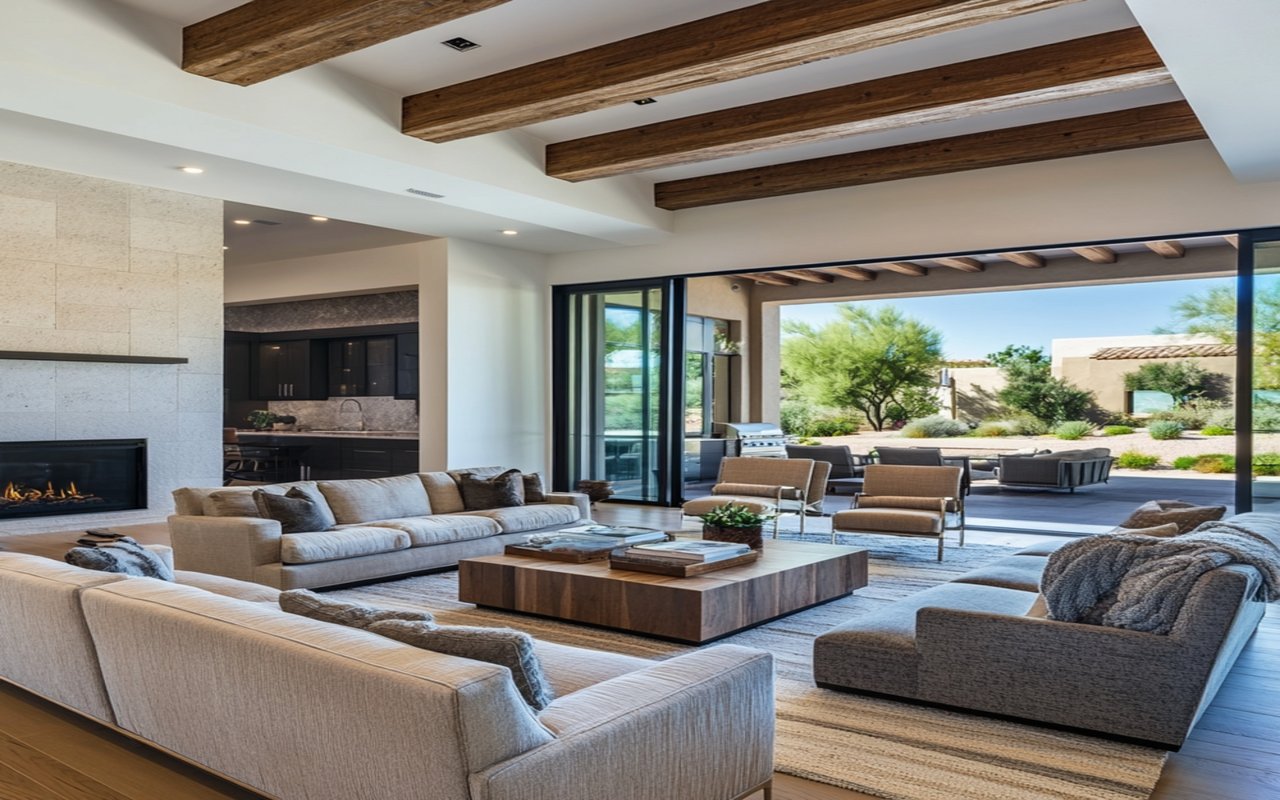
This is truly the most important question to answer. Forget the finances for a minute.

Discover why professional home staging is essential for attracting buyers.
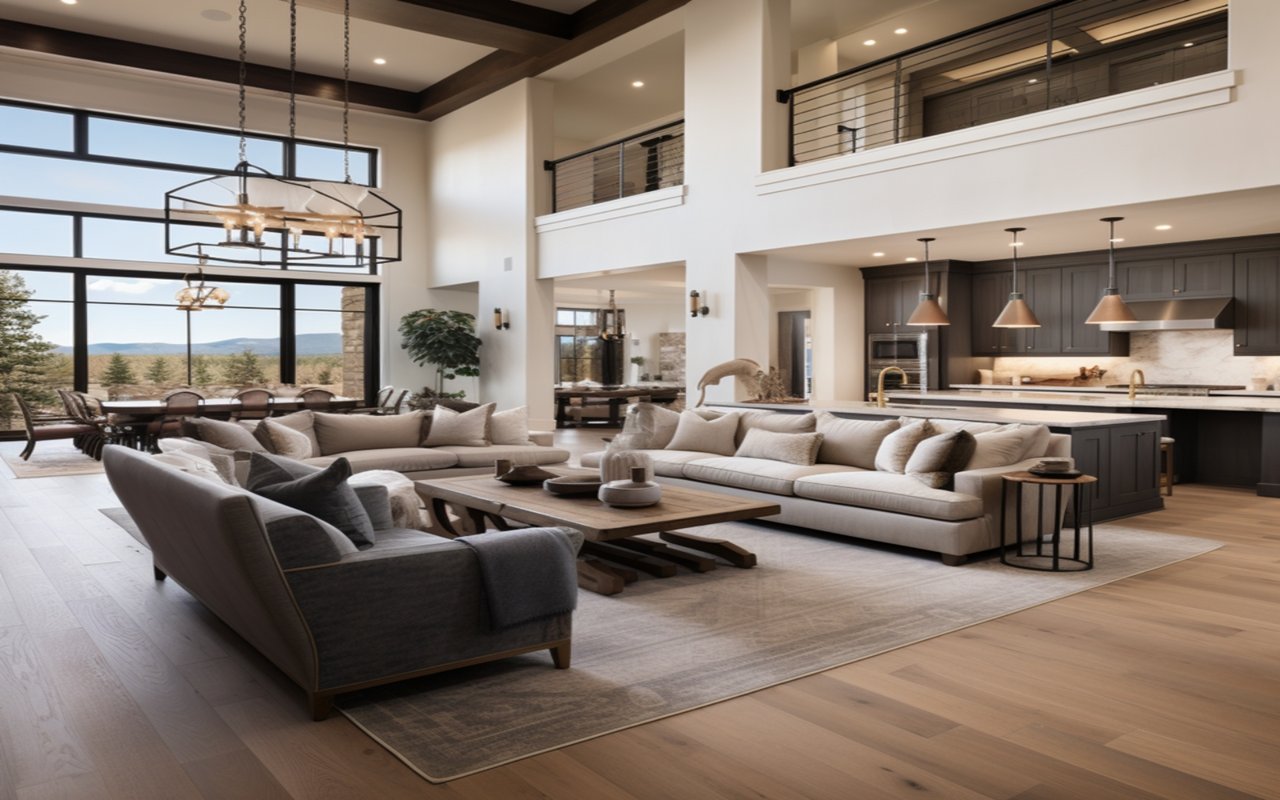
Navigate the shifting Greater Phoenix real estate market with insights on price trends.
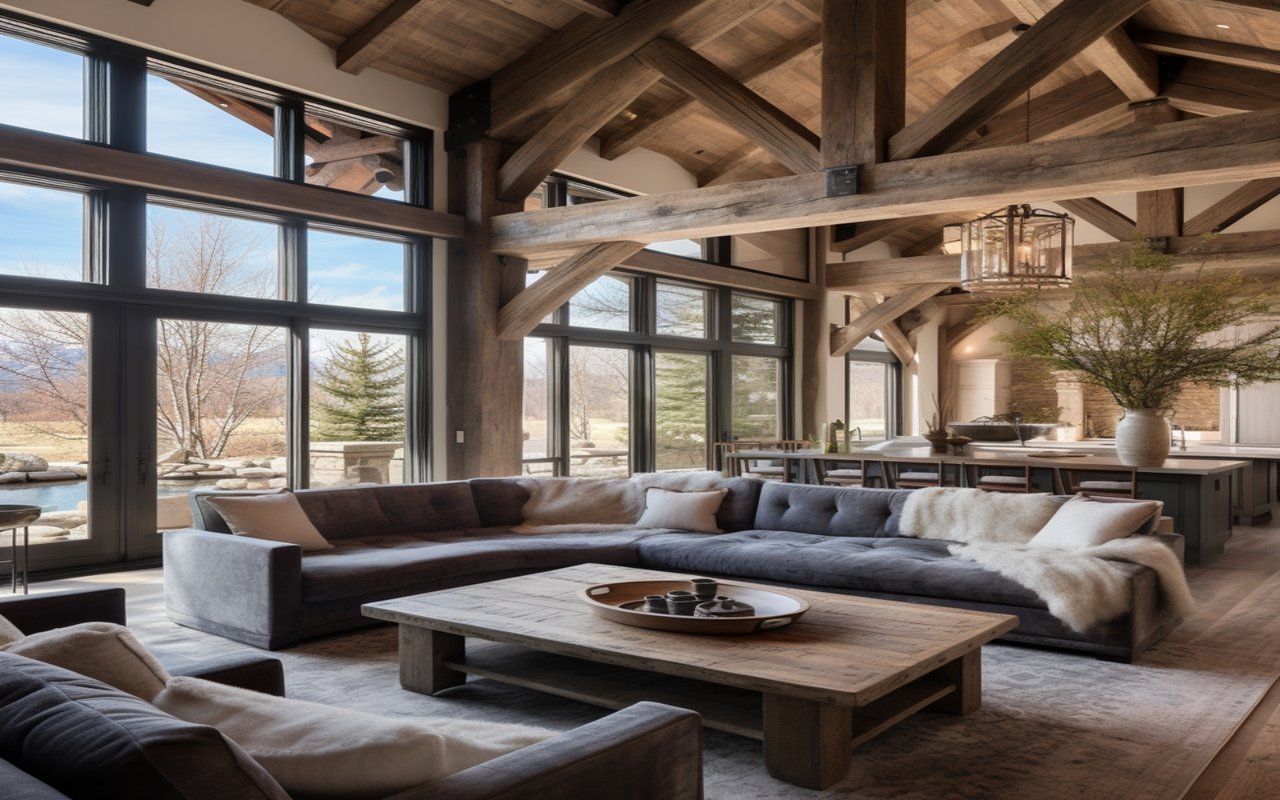
Don't let dated fixtures scare away potential buyers. Learn how to update your home's finishes.
At The Raegen Johnson Group, real estate has always been about more than buying or selling a home. It’s about the people, the relationships we build, and the trust we’re honored to earn. Every client becomes part of our story, and every relationship is one we cherish long after closing day.

THE RAEGEN JOHNSON GROUP
REAL BROKERAGE LLC
(602) 330-5362
[email protected]
3707 E Southern Ave STE 1074 Mesa AZ, 85206